


Flip on the nearest light switch any room. Go on, give it a try. Pretty amazing, huh? We used to have to make a fire, light an oil torch, or burn a candle to see and keep warm. Since Thomas Edison turned on the first power plant, the Pearl Street Station, in 1882 in New York City, the modern world has abundant and instantaneous access to electricity. Unfortunately, having electricity at the push of a button makes some of us forget what it takes to get it there. So where does our energy originate? The system that brings energy from the power plant to a home or business is the electrical grid. The process begins at a local power plant, where energy is captured from burning fossil fuels, or generated from renewable sources such as wind or solar. From there, electricity travels to a transmission substation, which prepares the energy to travel long distances by increasing its voltage. After traveling along power lines, electricity enters a power substation, where the energy is converted to lower voltages and distributed to homes and businesses. Thomas Edison turned on the first power plant, the Pearl Street Station, in 1882 in New York City. Today, national, state and local governments working with utility companies are renovating our electrical grids into ‘smart grids’. Take a look at the Smart Grid Infographic and start exploring the shift!
Activity 1 – The Electrical Grid

We get our power from a power grid. The power grid is a cross country network that includes generation of power at powerplants; substations (that begin to distribute the power); transformers and sensors; transmission and distribution lines. Look at this Electric Grid Infographic. The grid’s four main parts generate, transmit, distribute, and deliver energy to our homes, schools, and businesses for us to use. The United States has three discrete power grid regions called interconnections. They include the Eastern, Western, and Texan Interconnections. Take a look at the US Power Grid Map. Now take a look at the interactive energy use map of different power grids and check out the source of power. Electric Utilities are beginning to update the power grid to a digitally smart grid. The smart grid utilizes the same digital technology used in smartphones and computers to efficiently manage and distribute energy. The Smart grid consists of microgrids that can sustain power to an area in case of a power outage. Draw a picture of an electrical grid system and identify its key components. Use the explore links to research the smart grid. Identify areas in your drawing where the smart grid could improve efficiency, and then draw and label the changes.
Activity 2 – Renewable Energy
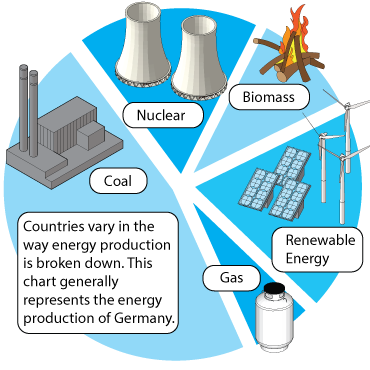
Though renewable energy is key to a sustainable future, wind and solar power aren’t currently as reliable as fossil fuels. Turbines require powerful gusts of wind; photovoltaics require direct sunlight. Take a look at energy produced by power plants that use coal, gas, oil, and water, wind and solar, and their placement. In order to capture more wind, utilities build turbines in open fields, or in higher elevations away from where people live. Because of their unreliability, renewable power generators are difficult to manage and use effectively, but a smart grid could change everything. New types of power lines, called HVDC lines (High Voltage Direct Current) allow wind farms to send electricity to towns hundreds of miles away. Look at a map of proposed wind powered transmission lines. Take a look at proposed transmission lines for solar power in the US. Digital management of the grid tells operators when the wind or solar generators operate at peak capacity. Then a utility could take a high-polluting fossil fuel plant offline for the time being. How green is your energy? Take a look at the United States State Map of Power Sources. Locate which state’s power plants are fueled by coal, wind, water, gas and oil. Research power plants in your community. Find out how many rely on fossil fuels, and how many take advantage of renewable sources. Draw a pie chart showing the percentage of plants powered by each. Could your town or city benefit from a smart grid?
Activity 3 – Watts, Kilowatts, Megawatts, Oh My!

Engineers, Scientists, and Utilities measure electricity in watts, which describes the rate at which energy is being used at any given moment. A watt is similar to the MPG (Miles Per Gallon) measurement on a car. Compared to an old gas-guzzler, an efficient economy car will have a higher MPG rating, and, therefore, burn fuel at a slower rate. Similarly, a 35-watt fluorescent bulb is more efficient than a 100-watt incandescent bulb, and will, therefore, use energy at a lower rate. The kilowatt contains 1000 watts. 1000 kilowatts is a megawatt. Kilowatts and megawatts describe power usage by a town or city scale. Pedaling a bike at a leisurely rate produces about 100 watts of power. Find out how much power household appliances, such as a dishwasher or refrigerator use. Then calculate how many people you would need pedaling bikes to power it. Next, research the output of your local power plant in megawatts. Calculate how many people would have to pedal bikes to match your power plant output. The number may surprise you!
Activity 4 – Smart Meters

Have you ever noticed a round, metal device attached to the side of your home? Have you ever wondered what the blinking numbers are recording? These devices are called utility meters, and they have been monitoring energy use in your home for decades. Meters display a cumulative monthly reading of your power use in kilowatt-hours, as well as current rates of energy consumption in kilowatts. Utility companies have begun replacing analog meters with new digital smart meters, which utilize digital technology to help customers be more aware of their energy usage. Digital smart meters send information in real-time to the utility company so that a customer can track his or her energy use throughout the day, month, or year. They can even send text message alerts when energy consumption jumps too high. With these new tools in place, users gain a better understanding of the role of energy needed and take active steps to conserve it. Find your power meter on the side of your home. How much power are you currently using? How much have you used this month so far? Compare your energy usage to the national average. How energy efficient is your household?
Activity 5 – Energy Usage

Utilities measure cumulative energy use in units of watt-hours (WH) or kilowatt-hours (kWh). A watt-hour describes the total amount of energy consumed at a rate of one watt over the course of one hour. A 100 watt light bulb left on for one hour consumes 100 watt-hours of energy. If left on for four hours, it consumes 400 watt-hours of energy. Larger devices or entire buildings consume amounts of energy in kilowatt-hours. For example, the average U.S. home consumes 909 kWh (kilowatt-hours) per month. Use the USEIA tables provided by the U.S. Energy Information Administration to find out how much utilities charge on average for electricity in your state. Next, identify devices being used in your home and calculate their watt/hour usage over the course of a year. Being mindful of unit conversions (watt-hours into kilowatt-hours), calculate how much it costs to run your device yearly.
Review
- When was the first electrical grid developed in New York City?
- How can we make the electrical grid more “green?”
- What does “HVDC” Stand for?
- If a microwave consumes 650 watts, and runs for a cumulative total of 1 1/2 hours a day, how many watt-hours does the microwave consume?
- Select the proper sequence energy takes in order to power your home:
- What purpose does a “digital smart meter” serve?
- Homes use up a lot of power. What unit of measurement would describe how much energy a home uses in a year?
- What is an easy way you can start conserving energy at home?
Explore
- Clean Energy
- Electric Grid Infographic Energy.Gov
- Electricity Data Browser
- Energy Grid of United States
- Energy Hog & Homes
- HVDC ABB
- Measuring Energy
- Myths & Facts: Smart Meters
- Reinventing the US Power Grid UNDARK
- Smart Energy 101
- SMART GRID 5G and Edge Computing
- Smart Grid Energy.Gov
- Smart Grid. gov
- Smart Grid Q&A
- Smart Grid QUIZ
- United States Electricity Data
- US Power Plant Map
- Video COnnode Smart Grid for Smart Cities
- Video How to find your meters!
- What is a Smart Grid Learning Center
- What is the Smart Grid?
Relate


All contents copyright © NEXT.cc. All rights reserved. Terms of Use