


 Diagramming

A diagram is a form of visual communication.
A composition of lines, marks, and/or symbols, diagrams communicate an idea and attempt to reveal concepts in their simplest forms. Almost everything can be abstracted into a diagram. Diagrams represent organizational time, space and movement, or even a set of ideas or relationships between ideas. Diagrams are a visual part of the thinking process and can record analysis and response. Diagrams can include words and numbers and communicate statistics, data, interactivity, adjacency, and even construction instructions. Diagrams are abstractions that conceptualize and strategize concepts. A diagram can be shown by itself, or overlaid onto photographs or drawings, or even models. Almost every discipline uses diagrams to communicate content. Diagrams can record general information and also explore and evaluate alternative ideas. Lines can show symmetry, relationships, connections and boundaries. Different line weights and types communicate different connections. Arrows show movement in one or more directions. Different arrow types and sizes can indicate relevancy or importance.
Diagrams are powerful visual tools that communicate ideas.
Activity 1 – Analytical Diagram
Did you ever want to change the light bulb as the icon for a good idea? Now is your time! Good ideas come in many shapes and sizes. Good ideas present changes in thinking. Diagramming is a tool that assists in exploring, analyzing, creating and communicating ideas! Diagrams use images, lines, fields,** arrows,** symbols and words to communicate. Diagrams are like Xrays in that they can abstract information and reveal relationships. Diagrams speak about quantity, quality, data, and interactions. Diagrams can selectively communicate ideas. Diagrams can reveal innovative possibilities. Try diagramming your activities during the day. What objects and people do you interact with? Diagram your cat or dog’s activities. Diagram your time on the school playground. Once you start, you will find you can diagram anything. Try diagramming the big bang theory, evolution, or DNA. Try diagramming circulation, site conditions, activities, cycles, seasons. Making complex ideas understandable is the art of the diagram.
A good diagram speaks for itself!

Activity 2 – Conceptual diagrams

Conceptual diagrams register ideas in quick and simple ways. Take a look at Visual Notetaking and consider how making a conceptual diagram with annotations to express a paragraph of information in an image that speaks directly to the points being made. Conceptual diagrams can quickly present ideas about quantity, quality and character. Conceptual diagrams often combine sketching or images with labels, numbers and symbols. Create a conceptual diagram that shows where you live now and where you would like to live in the future!
Activity 3 – Compare and Contrast (Venn Diagrams)

Let’s visualize similarities and differences. Start with two overlapping circles. Label each separate circle with a topic. Now write characteristics that apply to both topics or are shared by both topics in the intersection of the circles. Next, list characteristics unique to each idea in the non-intersecting portions of the circles.
Pick six insects, birds and animals in your region and compare and contrast how they are alike and how they are different. Interlocking circles are called Venn diagrams and help you visualize how things are alike and how they are different. It also helps you see details, make connections, and synthesize ideas.
Run circles around your Venn diagrams!
Activity 4 – Bubble Diagrams

Bubble diagrams are a lot like word webs that connect multiple ideas. The size of the bubbles often communicates square footage, or frequency, or hierarchy (what is important). Bubble diagrams start to link activities with population, with scale, frequency and size. Bubble diagrams are usually labeled and sometimes are color coded as well. Bubble diagram your day’s activities - sleeping, school, friends, etc. Diagram the rooms of your house. Bubble diagram your school.
Build bubble diagrams!
Activity 5 – Adjacency Diagrams
Adjacency matrixes are used to explore and reinforce overlaps of systems, spaces and activities. Using gridded paper, write down a series of attributes (hot, cold, wet, dry, loud, quiet, soft, hard, open, closed, inside, outside, etc.) along one axis. Next write down activities such as sleeping, eating, working, playing, socializing on the other axis. See what connections you need in the spaces you live in.
Optimize your living!
Activity 6 – Spatial Diagrams
Spatial diagrams show how circulation and activity zones define interior volumes (and sometimes exterior forms). Spatial diagrams are used to analyze space flow or movement of people into, around, through and out of a space. Activities are often color coded to show active or passive, wet or dry, public or private. Pick a space you know and analyze its space flow. Can it be improved?
Activity 7 – Diagramming Buildings

Diagramming is also a useful tool to capture ideas about shape, form and function. Take a look at buildings around you. Can you visualize diagrams that express their form? Can you imagine the diagram that expresses their organization? Can you imagine lines, symbols, and words that can communicate its personality? Find a building and analyze it in 3 stages from most abstract to more real.
Use different line weights and different colors for emphasis.
Activity 8 – Express Ideas in A Diagram

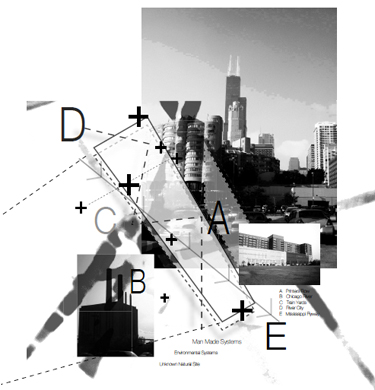
Diagrams help to simplify complex ideas and make them memorable. We know that people remember things much better when they see them visually. A diagram can abstract meaning from a complex field and communicate it quickly. In this example, the physical form of a lakefront is communicated quickly as a series of parallel, angular lines. The location of a building site is shown in red. See how much easier it is to recognize the building’s location on the diagram than the photograph. Try creating diagrams from photographs, maps and drawings that communicate ideas quickly. Look at ScribbleMaps and find an aerial view of some place you know. Look for shapes of buildings in that place. Create the shapes in ScribbleMaps to abstract and represent key buildings in shapes. You can also diagram road intersections and locate important places you frequent.
Become a diagram master!
Review
- Diagrams can communicate ideas.
- Diagrams use lines, arrows, words and shapes.
- A Venn diagram reveals overlaps, similarities and differences.
- Adjacency matrixes can record proximities and attributes between functions and activities.
- Diagrams are intelligent extractions of visual information.
Explore
- 8th grade Practice With Venn Diagrams
- Architecture Diagrams Pinterest
- BIG Architects
- Concept Diagrams Tumblr
- Data Visualizations
- Diagramming in Space Planning
- Drawing/Diagramming PDF
- Gliffy Visuals in our DNA
- Interactive Sociogram
- Make a Venn Diagram: Read, Write, Think
- Matrix Diagrams
- NOBEL Laureates Diagram Their Projects
- Online Diagramming and Flowchart Software
- SWOT Diagramming Exploratree
- Tschumi Notations Diagrams Sequences
- Venn Diagrams
- Visual Complexity
- What are Venn Diagrams?
Relate


All contents copyright © NEXT.cc. All rights reserved. Terms of Use